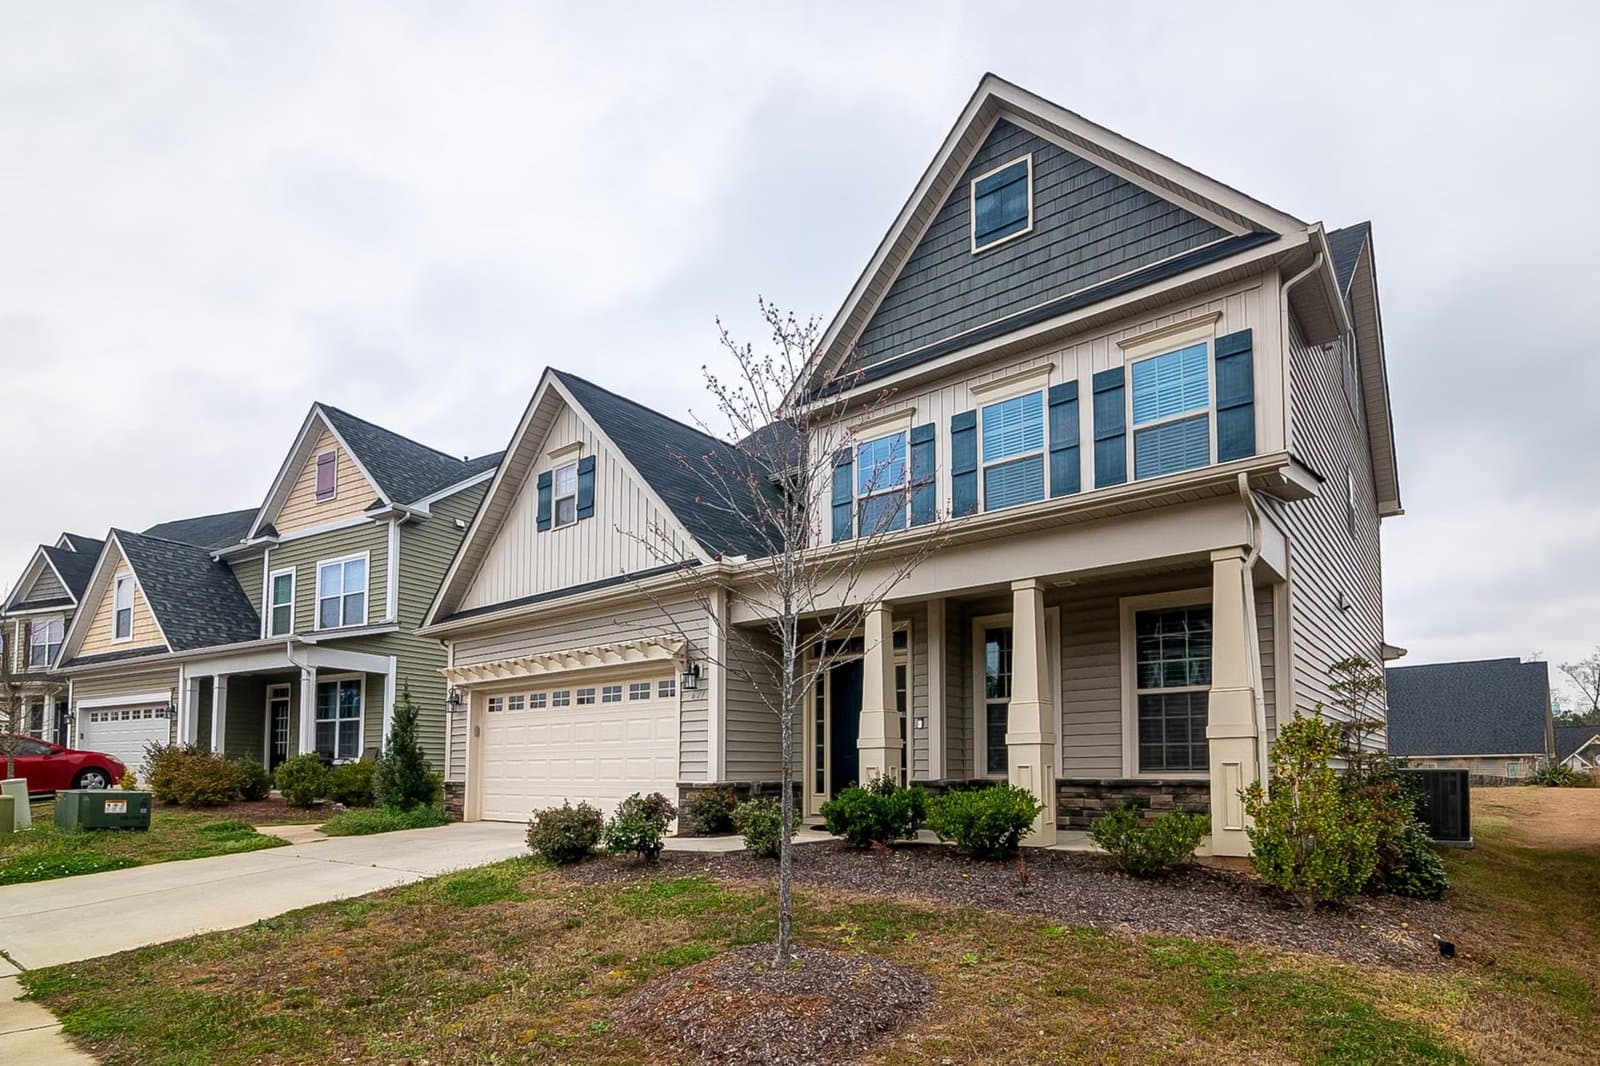

You've spent the summer watching new listings hit the market. Maybe you've been telling yourself a discount is finally coming. Before you write a fall offer, let's slow down.
The extra choice is real. The price relief isn't.
Key Takeaways
•The bottom line: More homes are for sale in Boston than at any July since 2020 (Homes.com, July 2026) — but prices are still climbing, not falling. You're getting patience and options, not a bargain.
•The reality: Median list prices sit near $879,000, up about 5.4% year over year (Centre Realty Group, June 2026). More inventory bought buyers time, not lower prices.
•Your real leverage: Negotiating room shows up on overpriced, aging listings — not on well-priced homes, which still sell in weeks near asking.
•The move: Treat this fall as a stability play. Target stale listings, keep your contingencies — the inspection and financing conditions that let you back out or renegotiate — and stop waiting for a fire sale the sale data says isn't here.
Why Didn't the Discount Show Up?
There's a real tension buyers are feeling right now: more listings and higher prices at the same time. That feels backwards. More supply should mean cheaper homes.
Across Boston, the median list price sits near $879,000, up roughly 5.4% from a year ago, even as sellers put more homes on the market (Centre Realty Group, June 2026).
So you'll see more options at open houses. What you won't see is meaningful relief in your monthly payment. This is a rebound from a historic shortage, and low supply relative to history keeps prices firm — standard supply-and-demand behavior from an unusually tight starting point.
If you're buying for long-term stability, not timing a crash, this market still deserves your attention. You just need to shop differently.
Why Doesn't More Choice Mean Cheaper Homes?
Boston is really running two markets at once. Listings are piling up on one side. Well-priced homes keep moving fast on the other.
The split shows up clearest between condos and single-family homes. Condos now carry 10.0 months of supply (city-of-Boston MLSPIN figures) — at today's pace, it would take ten months to sell every listed condo. Single-family homes carry just 5.2 months.
Boston Months of Supply by Property Type — July 2026
Primary MLS/Repliers comparison of supply conditions across Boston property segments as of July 2026.
| Series | Label | Value |
|---|---|---|
| Months of supply | Single-family | 5.2 months |
| Months of supply | Condo | 10.0 months |
| Months of supply | Mixed | 9.2 months |
Source:Repliers / MLSPIN
Buying a condo, you may have real room to negotiate. Chasing a single-family home in a strong school district or close-in suburb, the pressure hasn't let up.
Selling speed tells the same story. Single-family homes go under agreement in a median of 31 days, while condos take 48.
Boston Median Days on Market by Property Type — July 2026
Primary MLS/Repliers comparison of median selling speed across Boston property segments as of July 2026.
| Series | Label | Value |
|---|---|---|
| Median days on market | Single-family | 31 days |
| Median days on market | Condo | 48 days |
| Median days on market | Mixed | 43 days |
Source:Repliers / MLSPIN
Your leverage isn't on every home. It's on the stale ones.
As one local analysis put it, "Overpricing isn't being rewarded here. It's being corrected." That correction stays isolated to stale, overpriced listings — it isn't a market-wide price drop. Centre Realty Group notes the first 21 days on market now decide whether a home closes within 5% of asking or starts chasing the market down.
Your job is to find the sellers who already missed the market.
Is the Crash Talk Missing Something?
Let's be fair — the correction talk isn't coming from nowhere. Suffolk County inventory is up sharply since 2023 while sales run below normal. In many markets, that combination points toward falling prices.
But the timing doesn't fit a market about to break. If cuts were coming this fall, we'd expect falling sales and rising distressed listings. Instead, July sales rose 8% and foreclosures stayed low. Boston's July inventory was still 24.4% below the July 2019 total of 16,112 homes (Homes.com, July 2026). A rebound from famine isn't a glut.
About 4,960 homes sold in July, up 8% and the highest volume since 2022 — growth that ranked third among the 40 largest U.S. markets (Homes.com, July 2026). Buyers still step in when price and property make sense.
That said, some high-demand inner-ring towns are seeing real relief. Belmont's median ran about $1.4 million in March 2026, down 15% year over year (Redfin). So "the pressure is still real" holds broadly, but not everywhere. A few softer spots don't add up to a citywide fire sale.
A second objection: the "prices still rising" story leans on sticky year-over-year list prices, which are really seller wish-lists. But closed-sale data — what buyers actually paid — doesn't show a collapse. Boston's July median sold price was $1,027,500 for single-family homes and $765,000 for condos (city-of-Boston MLSPIN figures; sold, not list).
A related worry: prices lag sales, so today's closings reflect deals struck weeks earlier, and real cuts could still show up this fall. Possible for some listings. But the same evidence applies — inventory sits below 2019 levels and sales keep growing, not shrinking. A market feeding real cuts into the pipeline would show falling volume and rising distress. Boston shows neither.
More inventory without forced sellers gives you time. It doesn't automatically hand you a bargain.
Why Are Single-Family Homes Still So Hard to Buy?
The single-family tier stays stubborn because Boston hasn't built enough of it. Families still want yards, bedrooms, transit access, and top school districts. But listings in Newton, Brookline, and Belmont haven't kept pace with demand since 2022. That keeps pressure squarely on the homes buyers want most.
The price gap is wide. Single-family homes carry a July median sold price of $1,027,500, versus $765,000 for condos.
Boston Median Sold Price by Property Type — July 2026
Primary MLS/Repliers comparison of median sold prices across Boston property segments as of July 2026.
| Series | Label | Value |
|---|---|---|
| Median sold price | Single-family | $1,027,500 |
| Median sold price | Condo | $765,000 |
| Median sold price | Mixed | $855,000 |
Source:Repliers / MLSPIN
That difference hits your budget hard. It can change not just what you buy, but where — and whether you trade a yard for a shorter commute.
Single-family inventory grew just 4.3% year over year, while condos jumped 14% (Homes.com, July 2026). The stale-listing leverage play is far more available in condos than in single-family homes — the segment most buyers actually want. If you're hunting for a house, that targeted leverage may be thin exactly where you need it.
One bit of payment relief: the 30-year fixed mortgage averaged 6.67% as of Aug. 13, 2026, down from 6.69% the prior week; a year earlier it averaged 6.58% (Freddie Mac PMMS).
Mortgage Rate Context — June 18, 2026
Freddie Mac Primary Mortgage Market Survey mortgage-rate snapshot reported for June 18, 2026.
Freddie Mac PMMS
30-year fixed-rate mortgage6.47%
30-year fixed-rate prior week6.52%
30-year fixed-rate one year earlier6.81%
15-year fixed-rate average5.81%
That modest drop trims your payment a little. Call it help, not a game-changer.
How Should You Use Your Leverage This Fall?
The answer is simple but important: you have leverage, but it's targeted. It's strongest on aged, overpriced listings and weakest on fresh, well-priced homes in desirable locations.
If you're buying:
•Get a fresh pre-approval — a lender's written estimate of how much you can borrow — based on today's rates.
•Tour strong listings in the first week, before the best homes are gone.
•On stale listings, push for contingencies and a fair-value offer.
•Don't waive protections just because inventory is higher.
•Recent rules may require signing a buyer representation agreement spelling out your agent's fee before touring homes — confirm current requirements with your agent, and negotiate that fee upfront.
If you're selling:
•Price to today's market, not the 2025 peak.
•Treat the first 21 days as critical.
•Use fresh comparable sales — recent sales of similar nearby homes — not your tax assessment.
•Expect buyers to notice if your price runs too high.
And remember: Massachusetts closings typically involve an attorney — confirm the current requirement with your agent or closing attorney, and build that into your plan early.
So, Is Boston Finally Giving Buyers Price Relief?
Not broadly. Boston is giving buyers more choice, more time, and better odds on stale listings — plus a few genuinely softer towns. It isn't giving the market-wide discount many buyers hoped for.
That distinction matters. Waiting for a crash could cost you months while the right home passes by. Rushing into a fresh listing with no strategy could cost you money instead.
The smart move this fall is focused patience. Watch days on market. Compare property types. Know which neighborhoods are softening and which are still tight. Then negotiate hard where the data says you can.
Want the specific numbers for your neighborhood — stale listings, recent closed prices, and where buyers have the most room to negotiate? Reach out before you write your next offer.