# Inside One of Boston's Most Expensive Neighborhoods: Back Bay and 02115
Key Takeaways
•The short answer: Back Bay and the 02115 ZIP code anchor the top of Boston's housing market, where buyers pay more per square foot than anywhere else in the country, according to a Wall Street Journal analysis of Realtor.com data.
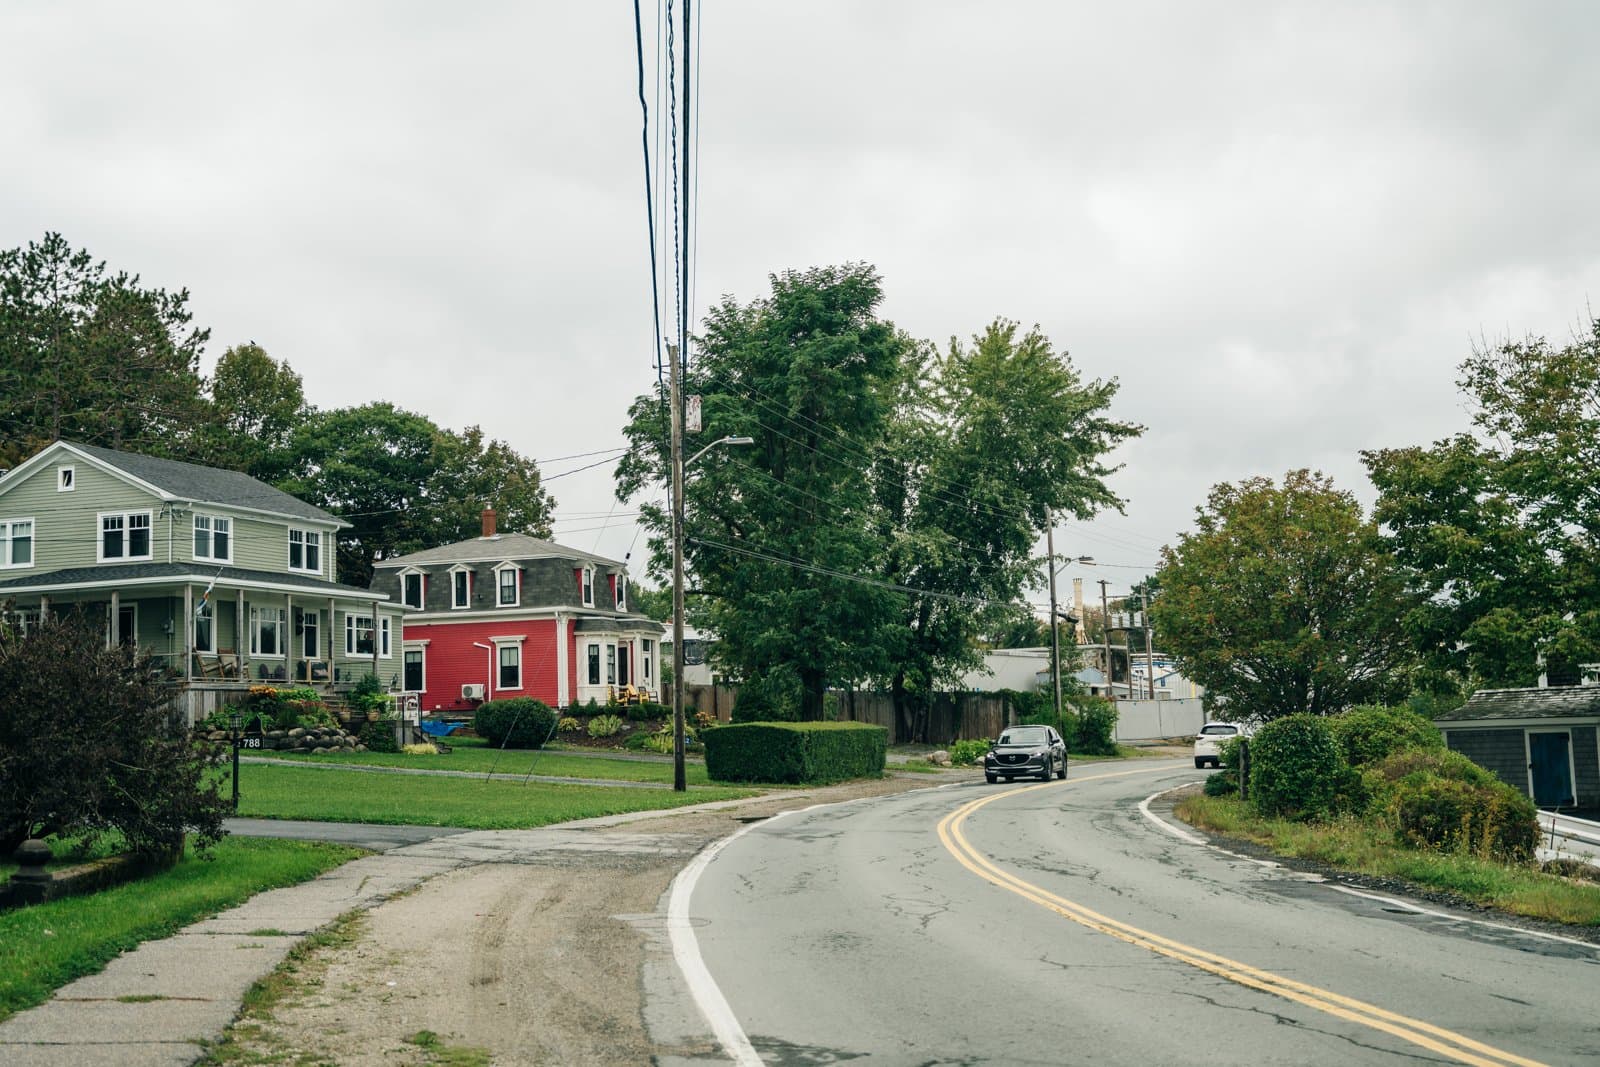
•The myth: "Boston" is one housing market with one average price. It isn't. The same city saw a high-end Back Bay sale near the top of the market and a far more modest East Boston sale in the same year.
•The reality: Among the neighborhoods of Boston, MA, your exact ZIP code drives your price far more than the word "Boston" ever could.
•The bottom line: Don't price or shop off a citywide headline. Get block-level numbers for your micro-market — and treat any single aggregate figure, even a flattering one, with caution. Even the metro-level 89.0% luxury-retention figure (Realtor.com May 2026 Luxury Report) is a regional reading, not a guarantee for your block.
Most people think of Boston as a single housing market. One average price. One trend. One answer.
That's not how Boston works.
When you search for the neighborhoods of Boston, MA, you're really asking a sharper question: Where does my money actually go? And in Boston, that answer can change block by block.
Here's the clearest proof. Boston's price ladder is extraordinarily wide. At the high end, Back Bay holds the city's priciest ZIP code by a significant margin. At the low end, neighborhoods like East Boston remain comparatively affordable. The point isn't any single dollar figure — it's the sheer width of that range, which no citywide average can capture.
Same city. Same year.
Searching "neighborhoods of Boston, MA" without a price-range map is like buying a home blindfolded.
Back Bay and 02115 aren't just expensive. They reveal exactly why Boston real estate is anything but one-size-fits-all.
Why Isn't Boston One Housing Market?
A citywide median price is useful for headlines. It's not enough for a buying or selling strategy.
That distinction matters because you don't buy "Boston." You buy a specific street, building, view, commute, and lifestyle.
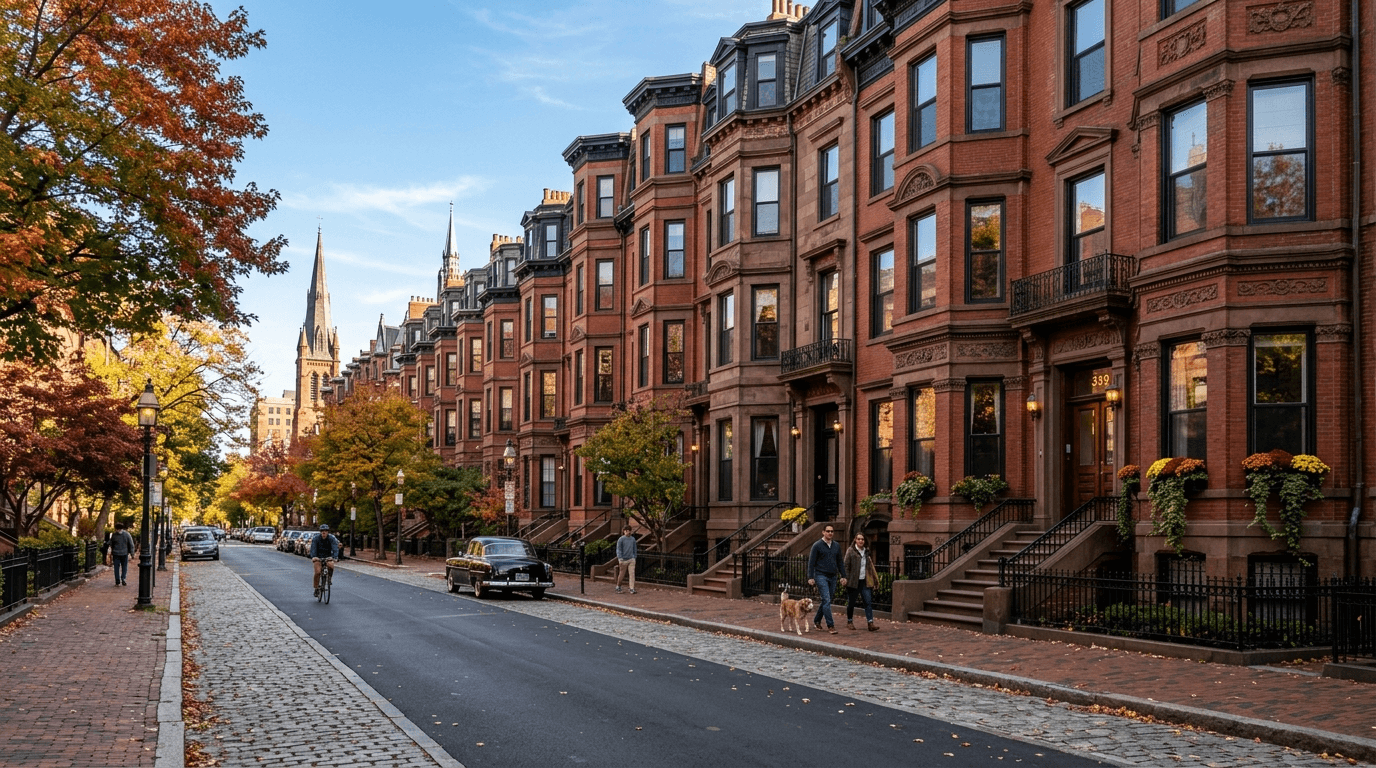
In Back Bay, buyers pay for things they feel every single day:
•Historic brownstones
•Luxury full-service buildings
•Walkability
•Shopping and dining
•Transit access
•Proximity to hospitals, universities, and offices
The gap between property types makes this concrete. Over the last 180 days, Boston single-family homes had a median sold price of $1,572,250, per Repliers/MLSPIN data. Condos sold at a median of $675,000. Condos also moved far faster — a median of just 15 days from listing to sale, compared with 90 days for single-family homes.
These citywide property-type figures illustrate one thing: a single "Boston" number blends very different products together. They are not the recent sales of similar homes you should price against.
Boston sales market by property type: last 180 days
Primary MLS-based snapshot comparing Boston single-family, condo, and mixed residential market conditions over the last 180 days.
Single-family
Median sold price1,572,250
Median days on market90
Months of inventory12.0
Condo
Median sold price675,000
Median days on market15
Months of inventory23.3
Mixed
Median sold price967,500
Median days on market53
Months of inventory21.6
Source:Repliers / MLSPIN
So what does that mean for you?
One "Boston number" can hide two very different markets. If you're selling, your price should reflect what buyers in your exact pocket actually value. If you're buying, your budget may stretch much further in one ZIP code than another. The right comparison set is always local — never citywide.
What Do the Numbers Say About 02115 and Back Bay?
The 02115 ZIP code covers parts of Back Bay, Fenway, and the Longwood medical area. That geography gives it a rare combination:
•Luxury housing
•Major hospitals
•Museums
•Universities
•Historic streets
•High-end towers
This is why pricing here sits at the very top of the market.
The Wall Street Journal reported a median of $2,663 per square foot for 02115, using December data from Realtor.com, and named it the priciest ZIP code in the United States.
Here's the important context behind that number. A major driver is One Dalton, the 61-story Four Seasons tower with 158 private residences. According to the same WSJ report, sales there have reached $4,000-plus per square foot. A handful of those ultra-luxury transactions pulls the 02115 median sharply upward. In other words, the $2,663 figure says more about One Dalton than about a typical Back Bay brownstone or a Fenway walk-up.
That's exactly why ZIP-level numbers, while better than citywide ones, still need a filter. The fix isn't to abandon ZIP-level data — it's to clean it. Pull recent sales of similar nearby homes. Then strip out outlier buildings selling far above the rest. For 02115, that means setting One Dalton aside. What remains is the price a normal home in the area actually commands.
Back Bay's appeal, though, goes beyond luxury pricing. It's also exceptionally walkable and transit-friendly.
Back Bay mobility profile
Walk Score’s primary neighborhood mobility scores for Back Bay across walking, transit, and biking access.
Walk Score97/100
Transit Score96/100
Bike Score87/100
Scale: 0-100
A 97 Walk Score, 96 Transit Score, and 87 Bike Score mean most daily errands don't require a car. For buyers, that translates to fewer transportation headaches. For sellers, your location is part of your value proposition.
The people who live in Back Bay also help explain the demand. Back Bay's 2025 profile shows a median household income of $128,700, with 74% of residents holding a bachelor's degree or higher.
Back Bay 2025 neighborhood profile
A mixed-unit demographic profile of Back Bay, suitable as a table rather than a single-unit chart.
| Category | 2025 Stats |
|---|---|
| Occupancy Rate | 87% |
| Owner-Occupied Units Percentage | 35% |
| Median Household Income | $128,700 |
| Percentage of Residents with BA or Higher | 74% |
| Foreign-Born Residents Percentage | 20% |
| Walking to Work Percentage | 35% |
High incomes and strong education levels tend to support sustained housing demand — and Back Bay has both in abundance.
One more data point adds useful context. According to the Realtor.com May 2026 Luxury Report, the Boston-Cambridge-Newton metro area has held onto 89.0% of its pandemic-era luxury price run-up, ranking third in the nation. This is a metro-level figure — no Back Bay- or 02115-specific retention number is published — so treat it as a rough proxy for the broader region, not a direct measurement of any single neighborhood. It points to a steadier metro luxury market than many buyers might expect, and nothing more.
But Won't the Luxury Bubble Pop?
It's a fair concern, and it deserves a straight answer.
Luxury markets across the country have not held up equally. Nationally, the luxury price floor hit $1,283,432 in May 2026, according to Realtor.com — marking the 26th straight month of year-over-year decline, down 1.4%. This is a real, sustained national downtrend, and Boston is part of that national market. The question isn't whether prices can fall. It's how much structural support a given market has under it.
Some markets have lost far more ground. According to Realtor.com, five markets have given back every pandemic gain. San Francisco fell the furthest, with its luxury threshold sitting $695,000 below its pre-pandemic baseline.
Prestige alone isn't enough. No market is immune — including Boston.
So why has the Boston metro held up better so far?
Anthony Smith, senior economist at Realtor.com, noted that markets keeping their gains have "real reasons for buyers to be there that have nothing to do with low mortgage rates and remote work." Boston fits that description, but the distinction worth making is structural, not just reputational. San Francisco also has top universities, hospitals, and high-paying jobs. What separates Boston is its economic composition. The city leans heavily on life sciences and health care, anchored by the Longwood medical cluster and a dense biotech corridor that kept hiring through the tech downturn that hit the Bay Area far harder. Add tight housing supply — constrained by historic-district rules and limited buildable land — and you have a market that's genuinely difficult to oversupply quickly.
Boston's demand anchors include:
•A life-sciences and health-care economy that kept hiring through the recent tech pullback
•Constrained housing supply from historic districts and limited buildable land
•High-paying finance jobs
•Long-term demand from students, doctors, researchers, and executives
None of this makes Boston crash-proof. It's a case for relatively more support, not immunity.
The numbers tell a nuanced story. According to the Realtor.com May 2026 Luxury Report, the Boston metro luxury price was $1.85M in February 2020. It peaked at $2.91M in May 2023. By May 2026, it sat at $2.74M.
That's a decline of roughly $170,000 — about 5.8% — from the 2023 peak. A real, ongoing pullback, not stability. It earns the label "pullback" rather than "crash" because the drop has been gradual and prices remain well above their 2020 starting point. But buyers and sellers should plan around continued softness, not a quick rebound.
What this means for your wallet: buyers are still paying for quality, location, and lasting value. They're just far less willing to overpay for a home that feels dated, poorly priced, or hard to justify.
What Are the Strongest Arguments Against This?
Two objections come up often. Both deserve a direct response.
Does a Trophy Sale Really Matter to a Typical Buyer?
Not by itself — and we never claimed it does.
The handful of ultra-luxury sales at the very top of the market represents a ceiling, not a norm. We use it for one narrow purpose: to show how wide Boston's price ladder really is. In the same city, in the same year, you can find a comparatively affordable East Boston single-family home and a multi-million-dollar Back Bay brownstone.
The takeaway isn't that everyone pays top-of-market prices. It's this: neighborhood selection drives price more than the word "Boston" does.
For buyers, that means comparing neighborhoods before falling in love with a listing. For sellers, it means pricing against your true competition — not the citywide average, and not a trophy sale either.
Could These Rankings Be Stale by June 2026?
The market has moved, but the broad ordering still holds.
The Realtor.com May 2026 Luxury Report shows the Boston metro luxury price drifting down slowly — from $2.91M in 2023 to $2.74M in May 2026 — rather than lurching. Movements of that size, spread over years, don't reorder a neighborhood ranking in a single quarter. Back Bay's per-square-foot pricing sits far above outer neighborhoods like East Boston, and a gap that large doesn't close in two quarters of normal market drift. That's the basis for expecting Back Bay to remain near the top and East Boston to remain comparatively affordable through summer 2026 — a reasonable read of the trend data, not a guarantee.
That doesn't mean every listing sells instantly. It means the top of the Boston metro market still has measurable support.
What Does This Mean If You Don't Live in Back Bay?
This is where the lesson gets useful for the rest of Boston.
You don't need to own a Back Bay brownstone or a 02115 luxury condo to take something from this market. Back Bay sets Boston's price ceiling — but it doesn't automatically pull every Boston home up with it. The outer neighborhoods, where most Boston buyers and sellers actually transact, follow their own rules.
What About Dorchester, West Roxbury, and Brighton?
These outer-ring neighborhoods are a different market from Back Bay, and they deserve their own analysis rather than a footnote.
Inventory tells the story most clearly. Listing counts vary enormously across neighborhoods, which confirms these are not interchangeable micro-markets.
Visible supply by major Boston neighborhood
Grouped comparison of for-sale and for-rent property counts in selected Boston neighborhoods with high visible inventory.
For sale
For rent
Fenway–Kenmore showed 3,523 rentals and 565 homes for sale. Back Bay showed 172 homes for sale and 424 rentals. Treat those as different worlds rather than apples-to-apples comps. Fenway–Kenmore lists more than three times as many homes for sale as Back Bay. Supply, buyer pool, and pricing dynamics differ sharply from one pocket to the next. More listings can mean more choice for buyers — and it can also mean sellers need sharper pricing and stronger presentation.
Outer-ring neighborhoods like Dorchester, East Boston, Roslindale, West Roxbury, and Brighton are generally more sensitive to mortgage rates than the cash-heavy top of the market. Buyers there are far more likely to finance, so monthly payments — not trophy-sale headlines — drive their decisions.
Mortgage rates have stayed elevated into 2026. According to Freddie Mac's Primary Mortgage Market Survey, the 30-year fixed rate has hovered in the mid-6% range nationally. When that rate rises, a buyer's monthly payment rises with it. APR is the yearly cost of borrowing, including interest and certain fees.
That's why a buyer at One Dalton may behave very differently from a buyer stretching into a first condo or single-family home in Brighton or Dorchester. And that's why citywide data can actively mislead you.
Your real market depends on:
•Your ZIP code
•Your property type
•Your price range
•Your condition
•Your block
•Your competition
Local residents feel this tension too. Online, the tone is often skeptical but nuanced — people praise Back Bay and the South End for walkability and downtown access while pushing back hard on the cost of living. As one resident put it bluntly: "It's literally one of the highest COL cities." Others defend the outer neighborhoods as strong communities, "just not much 'trendy' stuff going on there."
Both views can be true simultaneously. Boston can be brutally expensive and still offer very different lifestyles depending on where you land.
How Should You Use This Before You Buy or Sell?
Don't use Back Bay as your only guide unless you're buying or selling in Back Bay. Use it as a warning.
Boston is not one market. It's dozens of micro-markets.
For sellers, the goal is understanding what buyers value most in your exact neighborhood — then matching your pricing, prep, and marketing to that reality. For buyers, the goal is mapping your budget before you tour, so you don't fall in love with a neighborhood that doesn't match your payment comfort.
Here's the practical playbook for summer 2026:
•Ignore the citywide headline. One average hides dozens of different markets. Hold any single aggregate to that same standard — even a flattering metro-level figure like the 89.0% luxury-retention number (Realtor.com May 2026 Luxury Report) is a regional headline, not a read on your block.
•Get ZIP-level comps, then clean them. Comps are recent sales of similar nearby homes. Pull them for your exact pocket, then filter out outlier buildings selling far above the rest — the One Dalton effect — so your comparison set reflects normal homes, not trophies.
•Read the right local signals. Check the sale-to-list price ratio, days on market, and months of supply for your specific neighborhood. These tell you far more than any metro-wide figure.
•Price to your micro-market. Your exact ZIP code dictates your Boston home selling strategy.
The Boston metro holding 89.0% of its luxury run-up (Realtor.com May 2026 Luxury Report) is a modestly reassuring regional signal. But it's a metro aggregate, not a neighborhood guarantee — and the national luxury market is still declining.
Strength at the top doesn't erase the gaps below it.
The distance between the most affordable East Boston homes and the priciest Back Bay sales isn't luck. It's location. Once you understand that, you can make a much smarter move.
If you're thinking about buying or selling in Boston, start with your exact neighborhood numbers — not the citywide headline. Get the ZIP-level comps, pricing range, and competition map before you make your next move.