Neighborhood-level context to help you buy or sell with confidence.
Learn how Brookline property tax bills work when the rate stays flat, including assessments, levies, exemptions, and owner deadlines.
Somerville condos carry 11.3 months of inventory versus 7.2 for single-family homes, giving buyers more room to compare and negotiate.
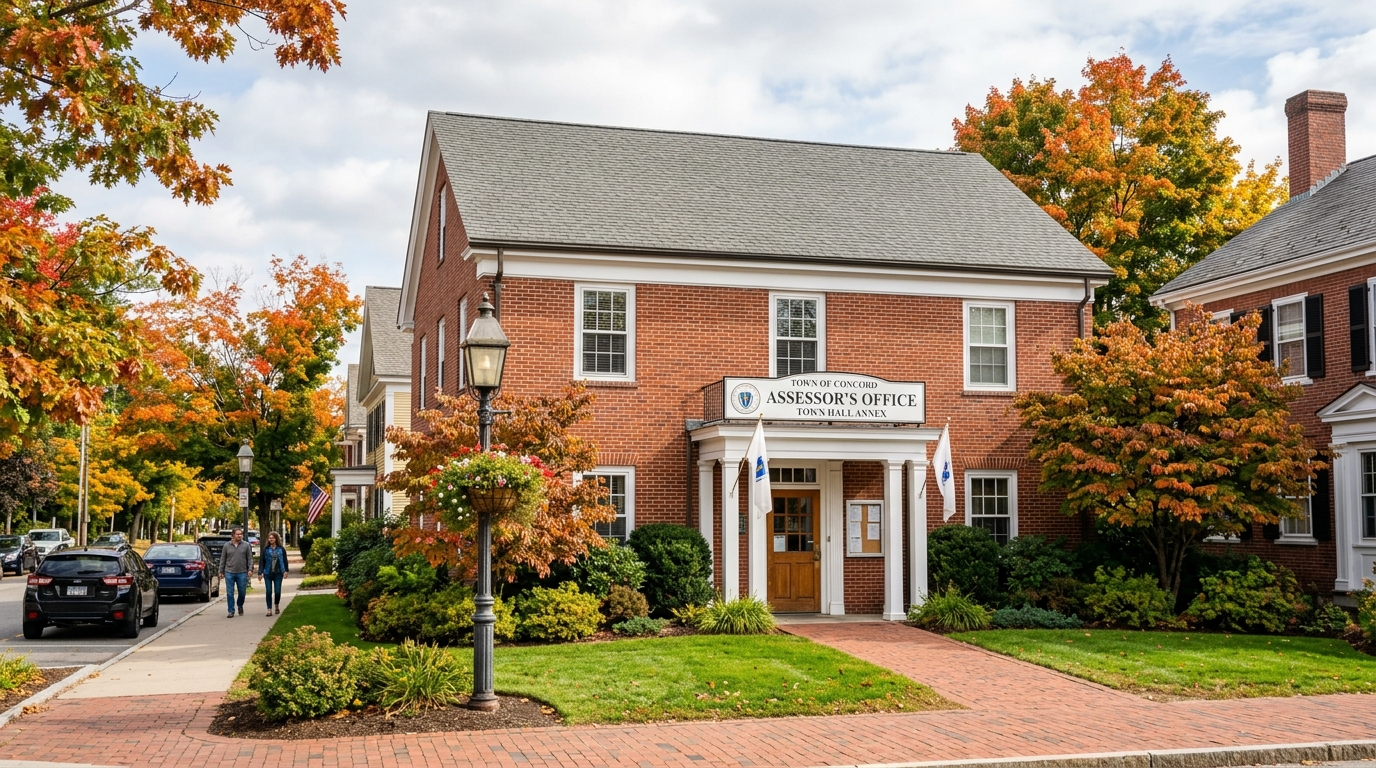
Use the assessor’s card, certified tax rate, revaluation history, and override records to estimate Massachusetts property taxes before you write an offer.
Learn why assessed value matters more than the headline rate when estimating Newton property tax bills for homeowners and buyers.
Use Needham’s FY2026 tax math, comps, and buyer-cost clarity to defend a smarter summer list price without overpricing.
What Wellesley sellers should know after The Mansions at Wellesley 40B denial, from appeals and revisions to supply risk and pricing strategy.
Learn how Boston sellers can vet down-payment assistance offers, confirm approvals, check loan math, and negotiate credits without misreading buyer strength.
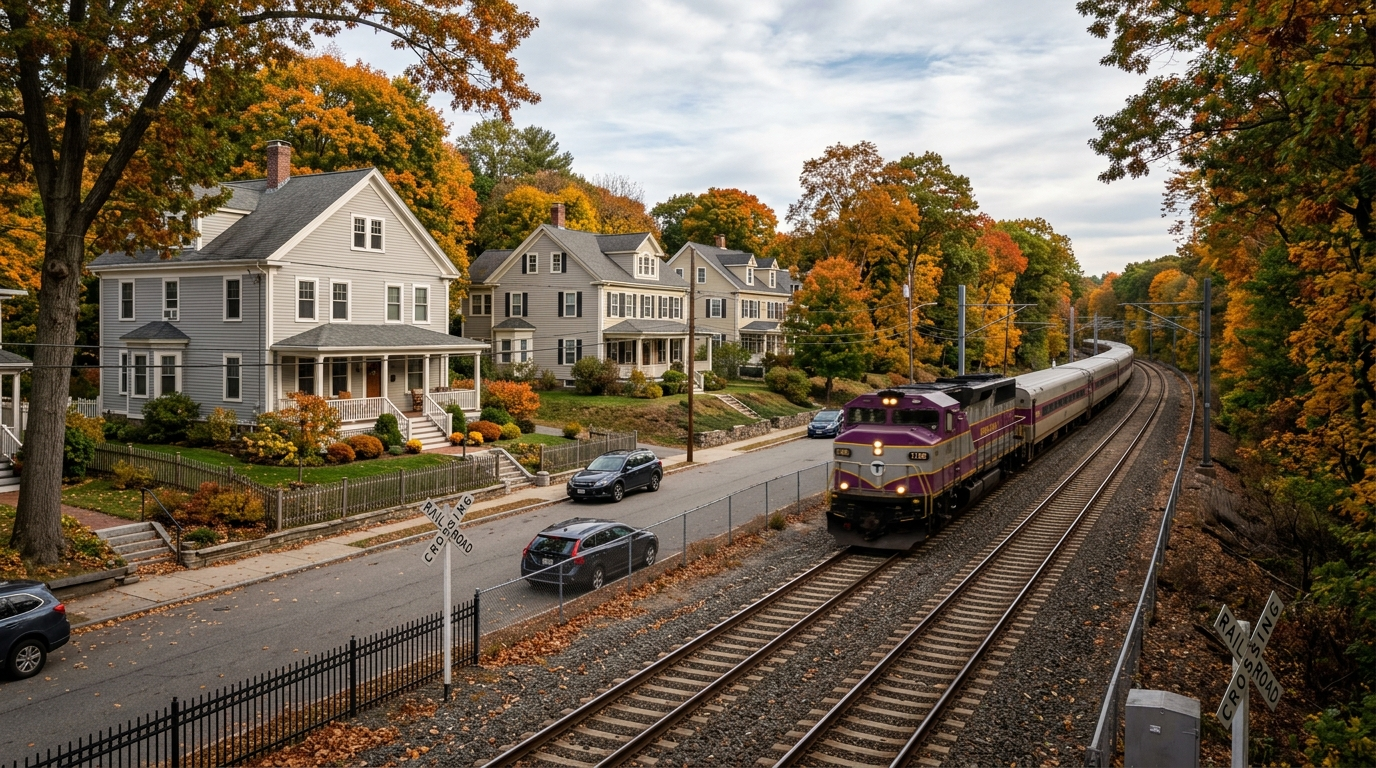
How Needham’s MBTA Communities zoning shift could reshape seller comps near commuter rail—without assuming today’s prices already prove it.
Boston homeowners face a 13% property tax increase, showing how office-value declines can shift costs in commercial-heavy MA cities.
Explore East Boston’s waterfront appeal on a Boston neighborhoods map, with context from citywide inventory and neighborhood price charts.
See Boston neighborhoods by price tier, from Reach to Starter-Friendly pockets like Brighton, Dorchester, Roslindale, and East Boston.
See why lot size, build era, and matched Needham Heights sales matter more than townwide medians when pricing or appealing a home.